T
TedM
There is something odd going on (understatement).
This morning I asked DECC to publish the data that was used to create the graph that Barker used in his meeting with EAC/ECC on Tuesday (I guess most of you saw that).
According to DECC the data is here - www.decc.gov.uk/assets/decc/11/stat...weekly-solar-pv-installation-and-capacity.xls
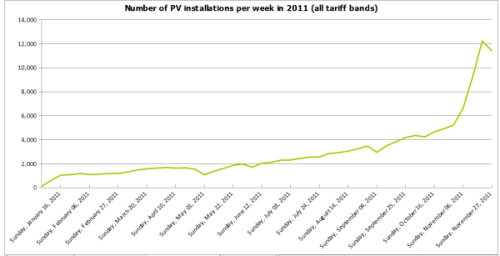
This data is sourced from MCS so only covers systems up to 50kW. The graphs are nowhere near those used by Barker. They do not show the large increases in August, September and October that Barker claimed had forced him to issue the emergency consultation.
The only big increase is in registrations after the consultation was announced - and we all know why.
I still feel that they must have used capacity data which included the solar farm installations (around 100MW I estimate) that were registered with OFGEM during that period. It is completely disingenuous for DECC to have included that data as it is clearly a one-off given that they have already alter FiTs rates to prevent them.
Here's the graph:


